A company with a well-run 13-week cash forecast and nothing above it can see every payment it has to make and still walk into a funding event with no warning. A company with an annual budget and nothing below it can present a confident plan to its board in the same month it misses a payroll. Both failures are common, both are avoidable, and neither is fixed by making the other instrument better. They are different questions and they need different models.
Two horizons, not one
The 13-week is a direct forecast. It is built from open ledgers — named invoices, aged payables, the payroll calendar, the tax obligations diary — and it answers an operating question: can we pay this, and if not, what do we chase and what do we delay. It is maintained weekly, it is owned by finance, and its natural audience is the executive team.
The rolling 12-month is an indirect forecast. It is derived from a driver model — volume, price, retention, headcount, working capital days — and it answers a strategic question: does the plan fund itself, and if not, when does that become a problem and what are the levers. It is rebuilt monthly off the closed ledger, it is owned jointly by finance and the executive, and its natural audience is the board, the bank and any incoming investor.
The failure modes are different too, which is the real argument for running both. The 13-week fails by being wrong about timing on individual items; the error is visible within a fortnight and self-corrects through the variance loop. The 12-month fails by being wrong about a driver — a conversion rate, a churn assumption, a hiring pace — and that error is smooth, plausible and invisible for months. One instrument catches errors quickly and sees nothing far away. The other sees a long way and catches errors slowly. You need both.
Rolling, not annual
This is the distinction that matters most, and it is the one most often skipped. A budget set in March and defended until the following March is a fixed target, and a fixed target decays. By September its assumptions are six months stale, the horizon it covers has shrunk to six months, and the conversation about it has stopped being "what should we do" and become "why are we off plan". That second conversation is about accountability for the past. It is a legitimate conversation, but it is not forecasting.
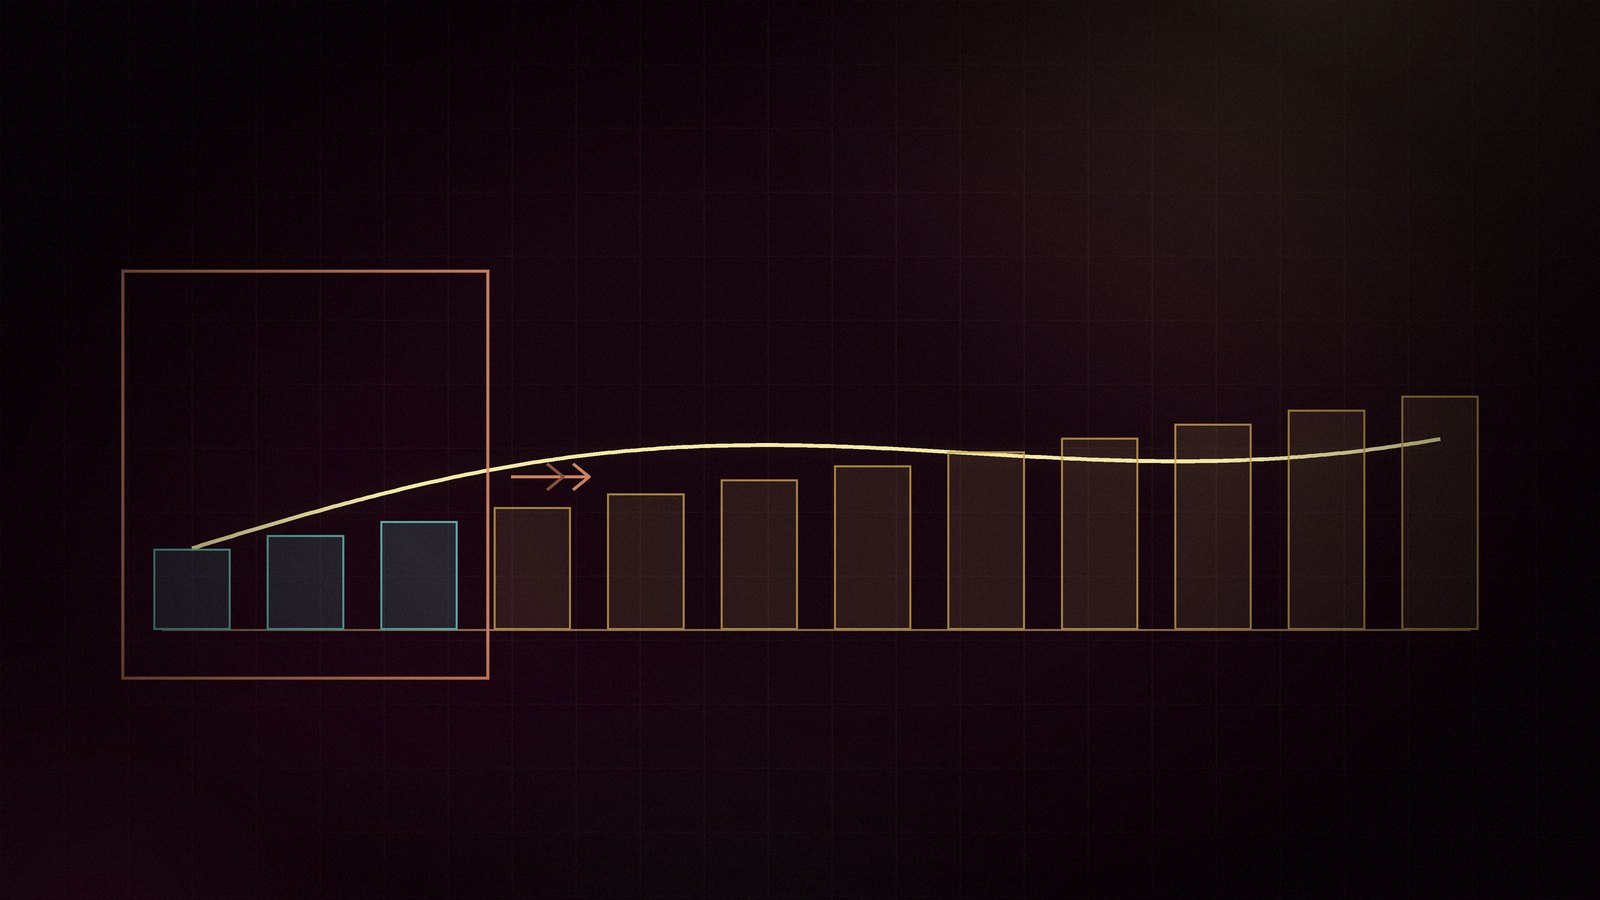
A rolling forecast always looks twelve months forward from the most recent close. The horizon never shortens. In September you are looking at the following September, and the decisions you can still influence are all inside the window.
Close the month. Drop the closed month off the front of the forecast. Add a new twelfth month at the back. Then re-forecast the whole window — not just the new month — against the actuals you have just learned. The budget does not disappear; it stays as the fixed comparative you report variance against. What changes is that the forward view is always current and always twelve months long.
Two objections come up. The first is effort: re-forecasting twelve months every month sounds like twelve times the work of an annual budget. It is not, if the model is built on drivers rather than typed numbers — you are updating assumptions, not retyping a spreadsheet. If re-forecasting is expensive, that is a diagnosis of the model, not an argument against rolling. The second objection is that a moving target destroys accountability. It does not, provided the budget stays in place as the comparative. Keep both: the budget is what you committed to, the rolling forecast is what you now expect, and the gap between them is the most useful number on the page.
The driver model underneath
Every line in the forecast must trace to either a driver or a schedule. A driver is an operating assumption someone in the business owns and can argue about — units, price, conversion, churn, headcount, days. A schedule is a contractual fact — a lease, a loan amortisation, a capex commitment. Nothing else is permitted.
A line typed directly as a number is a red flag, because nobody can interrogate it. "Marketing, $40,000 NZD per month" cannot be challenged; "marketing = customer acquisitions × cost per acquisition" can, and the argument you then have is about the business rather than about the spreadsheet. When a director asks what happens if conversion drops two points, a driver model answers in seconds and a typed model requires a rebuild.
The drivers worth building explicitly in almost every business: volume and price by revenue stream; conversion and pipeline for new revenue; churn or retention for recurring revenue; headcount by role with start dates and fully loaded cost per head; collection days, payment days and inventory days for working capital; the capex plan; FX rates where you transact in more than one currency; and interest rates on both drawn and undrawn facilities. Name the owner of each one. An assumption without an owner is a guess with a font.
Working capital deserves particular care because it is where profit and cash separate. Growth consumes cash through debtors and inventory before it produces it, and a plan that is profitable on paper can be cash-negative throughout precisely because it is working. Model collection days from observed behaviour rather than stated terms — the same discipline the 13-week demands, applied at a monthly grain.
Headcount, modelled properly
In most companies people are the largest cost line, and in most forecasts they are the worst modelled. The two common errors are using base salary as the cost, and treating hire dates as if they were certain.
The cost of an employee is base salary plus employer contributions, insurance, equipment, software licences, recruitment cost amortised over expected tenure, and the productivity ramp before they contribute. A common planning convention is to gross base salary up by roughly a quarter to two-fifths to approximate this. Treat that as a sanity check, not a rule — the right number is your own historical ratio of total people cost to total base salary, which you can calculate from your own ledger in an afternoon.
Timing matters more than the rate. A hire that slips a quarter changes the cash profile more than a ten per cent difference in their salary, because the slip moves an entire quarter of cost — and, if the role is revenue-generating, an entire quarter of the revenue that justified it. Model each planned hire as a named row with a start date, and be honest about how long recruitment actually takes in your market. Roles that have been open for months should not be modelled as starting next month.
Model the ramp as well. A salesperson does not produce at full quota in month one, and an engineer does not ship at full rate in their first sprint. If your model assumes instant productivity, every hire looks more affordable than it is, and the case for hiring earlier always wins.
Base, upside, downside
Three cases, each internally consistent. The temptation is to build the base case properly and then produce the other two by moving revenue up or down ten per cent. That is not scenario modelling; it is the same forecast printed three times.
The downside must be a genuine downside — the version where several things go against you at once, because in practice they do. Slower sales, slower collection, a customer lost, a hire you still have to make. What makes the downside useful is not its pessimism but its coherence: it should describe a world you can recognise, with the consequences followed through. If revenue is slower, collections are usually slower too, and the working capital assumption should move with it.
State the differences explicitly, on one page, so the board can see what separates the cases rather than inferring it from three sets of numbers.
| Assumption | Base | Upside | Downside |
|---|---|---|---|
| New revenue | Pipeline at current conversion and current sales cycle | Conversion improves; cycle shortens | Conversion falls; cycle lengthens; one named large deal does not close |
| Retention | Trailing twelve-month churn continues | Churn improves with the product work already committed | Churn worsens; one significant account is lost outright |
| Collection days | Observed behaviour by customer | Unchanged — do not credit yourself with faster collection | Lengthens, because customers under pressure pay later |
| Hiring | Plan as approved, with realistic start dates | Brought forward for revenue roles only | Frozen except for roles already contracted |
| Pricing | Current price, with any committed increase | Increase lands with no volume loss | Increase deferred; discounting to hold volume |
| Capex and facilities | Approved register; facilities as documented | Unchanged | Discretionary capex deferred; covenant headroom tested |
Runway as a decision framework
Runway is usually reported as a single number, which makes it a statistic rather than an instruction. It becomes useful when each band is tied to the decision it implies, because the point of knowing you have fourteen months is knowing what fourteen months means you should be doing this quarter.
The logic behind the bands is that a capital raise takes longer than founders expect, and that negotiating position collapses as cash gets short. A process run with eighteen months of runway is a choice; the same process at six months is a distress sale, and everyone on the other side of the table can see the difference.
| Runway (base case) | What it means | The decision |
|---|---|---|
| Over 24 months | Genuine optionality | Invest deliberately. This is when to take considered risk, because you can absorb the outcome |
| Around 18 months | Raise preparation window opens | Begin preparing — metrics, data room, investor conversations. Preparation is not the same as raising |
| Around 12 months | Actively raising | Process live. Also model the no-raise case honestly, because it is now a real path |
| Around 6 months | Too short to raise from strength | The decision is cost reduction, not fundraising. Reducing burn extends the window; a process at this point rarely closes on acceptable terms |
| Under 6 months | Solvency question | A board matter. Directors' duties engage, and the decision needs documented legal and insolvency advice |
These bands are a common planning convention, not a rule. The right thresholds depend on the business — a capital-intensive company with long sales cycles needs more warning than a services business that can cut cost quickly, and a company with committed facility headroom is in a different position from one without. Agree your own thresholds with the board in advance, in writing, while nothing is urgent. A threshold agreed under pressure is a negotiation; a threshold agreed in advance is governance.
Report runway under all three cases, and always report the downside figure alongside the base. Runway on the base case is the number management believes. Runway on the downside case is the number that determines when the board should act.
Reconciling at the overlap
The 13-week and the rolling 12-month cover the same first quarter by different methods. They must agree there. Where they do not, the difference is a finding, not a rounding.
Each month, put the first three months of the rolling 12-month next to the corresponding weeks of the 13-week, aggregated to months, and explain the gap in full. In practice the direct forecast is usually right, because it knows something the driver model does not — a large receipt slipping past quarter end, a provisional tax date nobody modelled, a supplier who has moved to shorter terms. The gap is where the driver model learns.
Run the reconciliation in the same direction every month and record the explanation. Over a few cycles a pattern emerges: if the driver model is consistently ahead of the direct forecast on receipts, the collection days assumption is optimistic and should be changed at the source rather than manually overridden each month. That is the mechanism by which the strategic model gets calibrated by operating reality, and without it the two forecasts drift into being two opinions.
Scoring the forecast you replaced
Every re-forecast should score the version it replaces. Not as a ritual, and not to assign blame, but because forecast error is information about the business and discarding it wastes the most useful data you generate.
The score is simple: forecast against actual for the closed month, the three largest misses by dollar value, and a classification of each as timing or quantum. A timing miss is a real event that landed in a different period — the deal closed, just a month later. A quantum miss is a different amount than expected, or an event that did not happen at all.
The distinction drives the response. Timing misses are a forecasting problem: the model's assumptions about lag, cycle length or collection behaviour need adjusting, and the fix sits with finance. Quantum misses are usually a business problem: the assumption about what the business can do was wrong, and the fix sits with whoever owns the driver. Persistent timing misses in one direction mean a systematically optimistic lag. Persistent quantum misses mean the plan is not the plan.
Keep the scoring history. Three or four cycles in, you will know which drivers are reliable and which are decorative, and you can present a forecast to a board with a defensible statement about its historical accuracy — which is worth considerably more than another confident chart.
Board, bank, investor — one model, three cuts
The rolling 12-month is also the covenant instrument. Project every covenant forward to the next four test dates under all three cases, and show headroom in the units the facility defines rather than in commentary. The downside case is the one that matters here: a covenant that holds comfortably on the base case and breaches on a plausible downside is a live issue requiring a conversation with the bank well before the test date, not a footnote. Banks respond very differently to a borrower who forecasts a tight covenant four months out and comes with a plan, than to one who reports a breach after the fact.
The same model serves three audiences, cut differently. The board needs the decision view: base and downside runway, the covenant position, the gap between forecast and budget, and the two or three decisions that need to be made this quarter. The bank needs the covenant and debt service view: headroom at each test date, facility utilisation, and the downside case in detail, because that is the case they are underwriting. The investor needs the growth view: unit economics, the drivers behind the plan, evidence that the drivers have been forecast accurately before, and a clear statement of what the capital buys. Same model, same assumptions, three presentations. If the three cuts do not reconcile to each other, you have three models and a problem.
The monthly rhythm
The rolling forecast is only as current as the close that feeds it, which is why a slow close quietly degrades strategic decision-making as well as reporting. A forecast built on a close that lands on working day fifteen is already half a month stale when the board sees it.
| Working day | Activity | Owner |
|---|---|---|
| 1–5 | Close the month. Actuals final, reconciliations signed off | Finance |
| 6 | Score the prior forecast: variance, three largest misses, timing or quantum | Finance |
| 7 | Driver review with each owner. Update assumptions where reality has moved | Driver owners |
| 8 | Roll the window: drop the closed month, add month twelve, re-forecast all three cases | Finance |
| 9 | Reconcile the first quarter to the 13-week. Explain every difference | Finance |
| 10 | Covenant projection to the next four test dates, all three cases | Finance |
| 11 | Board pack: runway by case, covenant headroom, forecast against budget, decisions required | CFO |
The days are indicative and will compress or extend with the size of the business. What should not move is the sequence: close, score, update drivers, roll, reconcile, project covenants, report. Scoring before updating is deliberate — you learn from the last forecast before you build the next one, not afterwards.
Five inputs feed the model, and each needs a system of record and a named owner. If any of them is sourced from someone's recollection, the forecast inherits that weakness.
| Input | Source of truth | Common failure |
|---|---|---|
| Ledger actuals | The closed general ledger, by entity | Forecasting from management estimates before the close is final |
| Debtor and creditor ledgers | Aged receivables and aged payables | Using stated terms rather than observed payment behaviour |
| Payroll and hiring plan | Payroll system, plus the approved hiring plan with named roles and start dates | Base salary instead of fully loaded cost; optimistic start dates; no ramp |
| Debt and lease schedules | Facility agreements, amortisation schedules, lease registers | Omitting fees, and omitting covenant test dates |
| Driver assumptions | A documented assumptions register with an owner per driver | Assumptions living inside spreadsheet cells where nobody can find or challenge them |
The assumptions register is the piece most often missing and the piece that does the most work. It makes the forecast auditable, it makes disagreement specific, and it makes handover possible. A model whose assumptions exist only in the head of the person who built it is a single point of failure, and it is the reason so many forecasts stop being maintained the moment that person is busy.
Build both horizons, reconcile them where they meet, and score them both against what actually happened. The rolling 12-month is not a longer 13-week and the 13-week is not a shorter budget. Run them as what they are — a strategic instrument and an operating one — and the board conversation moves from explaining the past to deciding the next quarter.

XLCFOChartered Accountants building AI-native finance functions for founders and boards. We build and maintain rolling 12-month models, scenario sets and covenant projections alongside weekly 13-week cash.